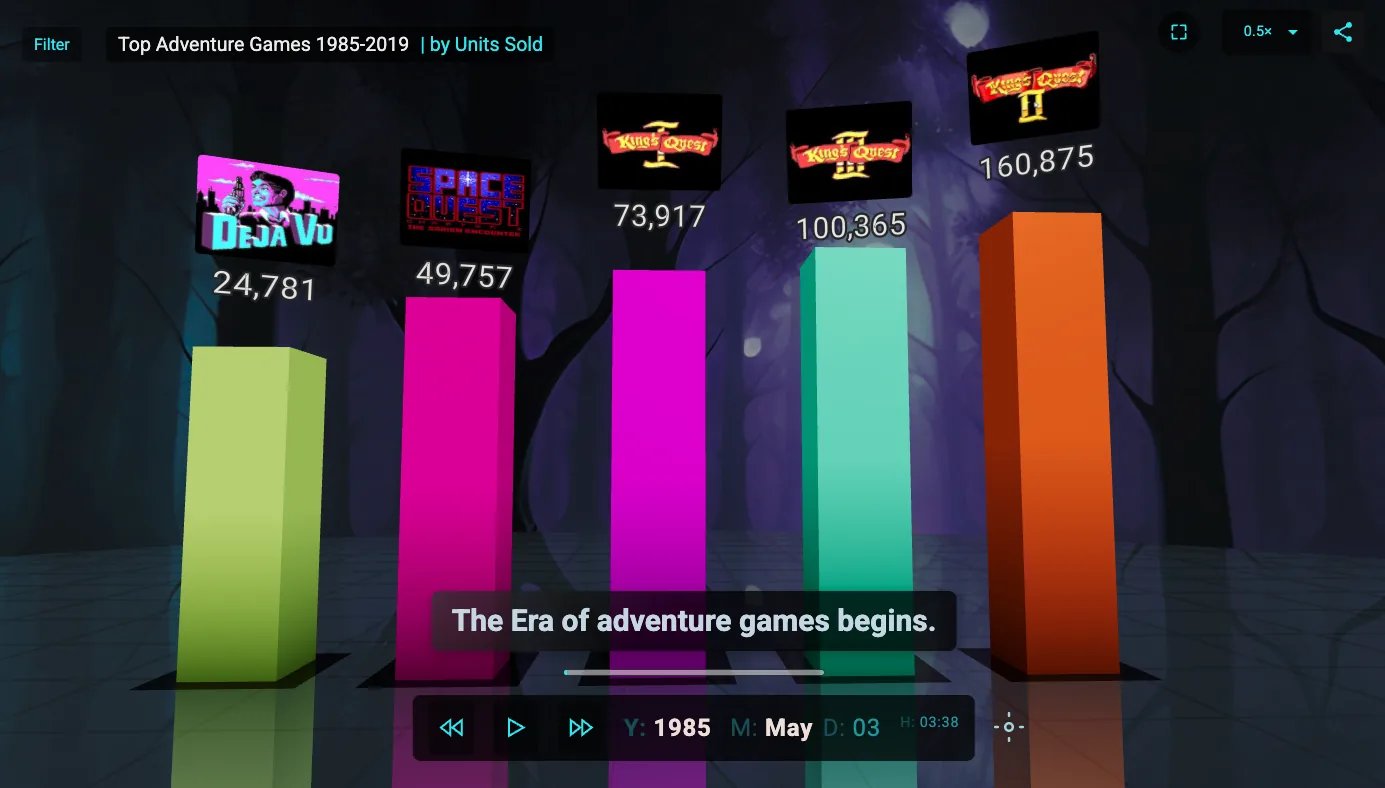
Persava3 is a browser-based platform I built from scratch to turn static data into cinematic, time-driven 3D stories — with no install and no code required from the person telling the story.
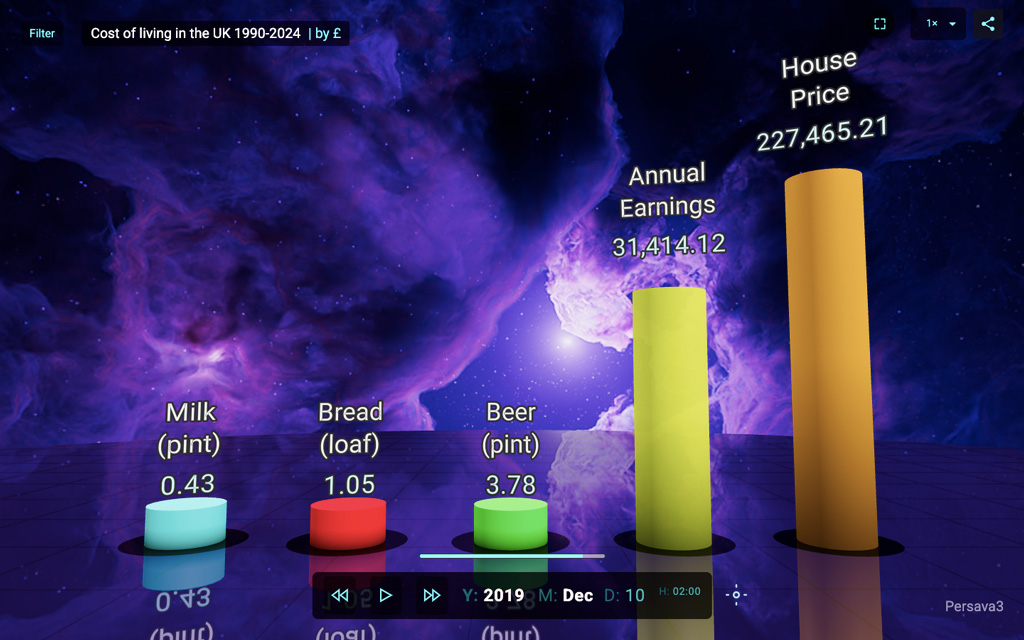
I designed and built it end to end: product idea, narrative structure, real-time 3D presentation, and the web experience people use. The aim was not another dashboard. It was to make complex information feel clear, memorable, and shareable — data unfolding through motion and time.
What it does:
- Turns datasets into animated 3D narratives in the browser
- Uses a dynamic camera and timed annotations to guide attention
- Supports custom branding for agencies and organisations
- Lets people craft and share stories without a technical pipeline
One public use case explores the UK cost of living from 1990 to 2024 — everyday essentials and earnings shown as a visual story across three decades. Other stories trace adventure game sales and the changing popularity of gaming genres. Explore Persava3 →
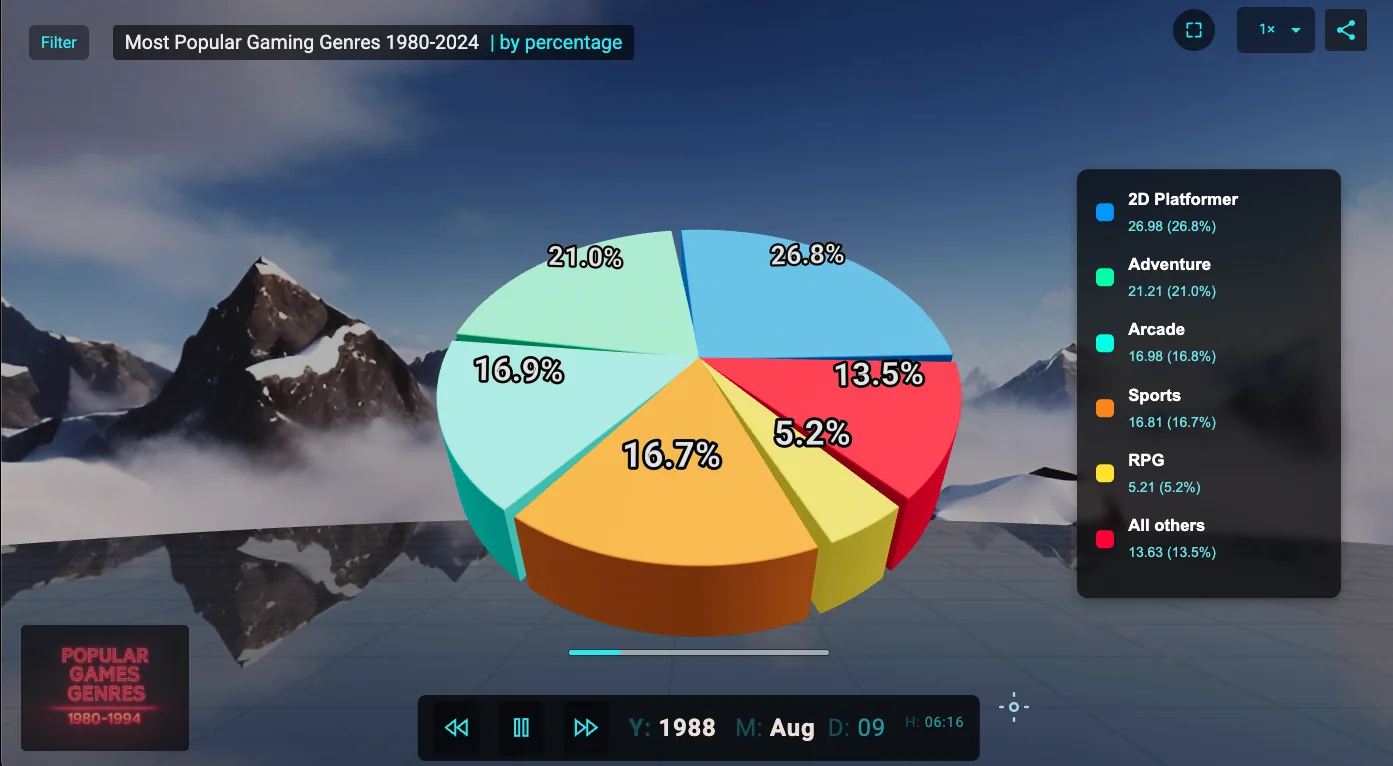
Persava3 sits in my practice where storytelling and systems meet: the same instinct that shapes films and interactive work, applied to insight you can actually feel.